#1 Database of
Outsourcing
Decision Makers

Boost Outsourcing sales appointments with the most accurate decision maker data spanning 70+ intelligence fields

Constantly Grow Your Business

Committed To Reach Your Total Addressable Outsourcing Market

You’ve scoured the web for specific set of Outsourcing contact data
Your Outsourcing accounts list is full of gaps and lacks accuracy
You’re reaching no more than 40% or 50% of Outsourcing target market
You know there are many more Outsourcing targets. Social channels prove it

Our data experts don’t just enable you to reach your target Outsourcing decision makers.
Our sales insights extend your reach to the total addressable market in 2021

United States Global
Q1 45,000 120,000
Q2 65,000 210,000
Q3 85,000 300,000
Q4 105,000 425,000

Double Your Growth

Connect With Your Hottest Leads

Explore Database of Top Outsourcing Contacts

Identify Buying Intent Of Your Market

Find Active Outsourcing Decision Maker

Win Your Next Big Client

Emerge as a Top Outsourcing Partner

Know how Lake B2B can help you align with big
budget Outsourcing influencers and founders.

We Don’t Like Bragging About Our Work

The Numbers Say It All

107%

Increase in Outsourcing leads per week

1200

Additional qualified Outsourcing leads

35%

Increase in e-mail driven Outsourcing revenue

139%

Increase in Outsourcing appointments


“Lake B2B’s platform including it tools, features, live streaming- enabled us to execute the event with confidence. We always believed that Lake B2B would be able to help us in delivering the best possible virtual experience for our attendees”

Timmy James, CEO and Founder


Convert your next big Outsourcing deal with hyper-personalization powered by Lake B2B data experts.

Find Specific Job Titles

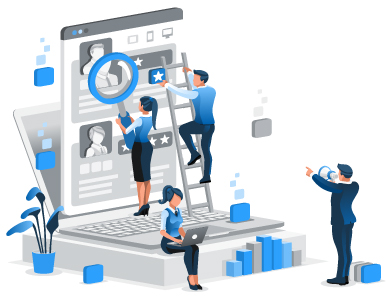
Drive meaningful conversations
With those who matter

There’s no point in running campaigns if you are not
reaching the key Outsourcing decision makers.

Run targeted campaigns to
close Outsourcing deals.

Inside This Database

  • Top C/VP level customer service executives
  • Top C/VP level customer care executives
  • Top C/VP level operations titles
  • Top C/VP level IT support teams
  • Top C/VP level Inside sales decision makers
  • Top C/VP level responsible for offsite teams

Target. Transform. Thrive.

How can Lake B2B can help you drive sales and marketing teams with an actionable database of Outsourcing decision makers.

Nurture All Potential Contacts

We have identified the most prospective Outsourcing job functions for your omni-channel marketing campaigns in North America

Reach those who are responsible for allocating budgets to hire,
empanel or on-board following:

  1. Customer Care Executives
  2. IT Support Center
  3. Customer Service Teams
  4. Accounting Support Services
  5. Business Process Outsourcing
  6. Knowledge Process Outsourcing

Break Through
Into Your Outsourcing Client’s Inner Circle of Trust

Our growth marketing experts can boost Outsourcing campaigns with cross channel audience targeting.


play

Reach Outsourcing Contacts


Global B2B Executive Data Cards From Lake B2B

The Best Way To Scale-Up Your Sales & Marketing ROI

Launch highly targeted multi-channel demand generation campaign for the Outsourcing domain.

Extensive Data Capture:

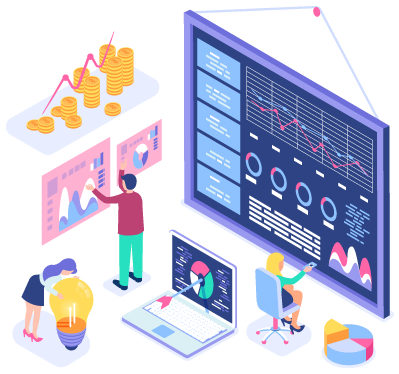
We have you covered from end-to-end.

Some of our form capture fields include:

  • First Name
  • Contact Name
  • Title
  • Company
  • Address
  • Country
  • State/Province
  • ZIP/Postal Code
  • Phone
  • Fax
  • Primary Industry
  • SIC Code
  • NAICS, Employees
  • Sales
  • Email
  • ZIP4
  • Web Address

There’s more to be discovered for your specific Outsourcing needs.

Overall break-up of accurately verified and segmented contacts

  • 6,306,908
  • 1,909,502
  • 3,819,396
  • 8,386,272
  • 4,637,514
  • 15,188,638

Available in formats including:

Email Marketing

Tele Marketing

Direct Mail

XLS

TEXT

CSV

TSV

There’s more to be discovered for your specific Outsourcing needs.

Size Up Revenues
To Double Up Sales

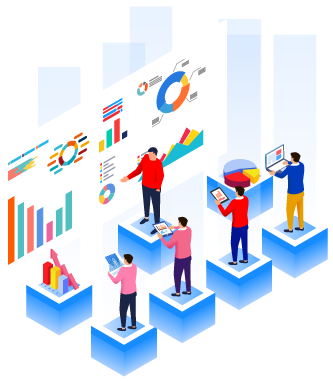
Grow with sales intent intelligence that helps build a high-quality lead pipeline of Outsourcing decision makers.

Assess the likely revenue trajectory of your Outsourcing clients. Now you can estimate your client’s growth plans to become an essential partner in their journey.

Revenue
Based Counts

Revenue

  • <$1Mil
  • $1M – $10M
  • $10M – $50M
  • $50M – $100M
  • $100M – $250M
  • $250M – $500M
  • $500M – $1B
  • $1B – $5B
  • $5B – $10B
  • >$10B
  • Unclassified

Records

  • 1,125,044
  • 3,341,818
  • 3,281,709
  • 1,766,994
  • 2,271,725
  • 1,730,183
  • 1,723,532
  • 4,244,003
  • 1,456,826
  • 3,920,197
  • 15,386,199

Get States Wise
Break-Up Of States
With Higher Intent

Set State Wise TargetsTo Meet Outsourcing Client Acquisition Goals.

Identify the best states in terms ofOutsourcing demand, buying
propensity, executive composition and more.

USA State
Based Counts

State

  • AK
  • AL
  • AR
  • AZ
  • CA
  • CO
  • CT
  • DC
  • DE
  • FL
  • GA
  • HI
  • IA
  • ID
  • IL
  • IN
  • KS
  • KY

Records

  • 72,751
  • 341,004
  • 204,418
  • 553,805
  • 4,420,953
  • 639,538
  • 560,926
  • 255,873
  • 97,078
  • 1,647,466
  • 1,060,079
  • 82,713
  • 310,372
  • 116,139
  • 1,830,514
  • 574,422
  • 287,329
  • 292,105

State

  • LA
  • MA
  • MD
  • ME
  • MI
  • MN
  • MO
  • MS
  • MT
  • NC
  • ND
  • NE
  • NH
  • NJ
  • NM
  • NV
  • NY
  • OH

Records

  • 294,101
  • 1,272,564
  • 678,124
  • 117,131
  • 960,683
  • 855,252
  • 633,077
  • 142,902
  • 78,594
  • 925,379
  • 68,751
  • 222,300
  • 144,921
  • 933,957
  • 117,151
  • 181,846
  • 2,162,182
  • 1,278,093

State

  • OK
  • OR
  • PA
  • PR
  • RI
  • SC
  • SD
  • TN
  • TX
  • UT
  • VA
  • VT
  • WA
  • WI
  • WV
  • WY

Records

  • 268,304
  • 396,035
  • 1,406,337
  • 10,921
  • 124,896
  • 308,451
  • 76,714
  • 576,422
  • 1,910,618
  • 269,364
  • 658,872
  • 69,410
  • 787,413
  • 705,196
  • 90,182
  • 40,310

Size Up The Best
Country For Outsourcing Deals

DriveOutsourcing Campaigns In the Best Target Market Geos.

Uncover unique insights on buying intent and fine-tune
youroutsourcingsales and marketing strategies.

Country
Based Counts

Country

  • USA
  • UK
  • Canada
  • Australia
  • India
  • France
  • Germany
  • The Netherlands
  • Italy
  • Singapore
  • Sweden
  • Brazil
  • UAE
  • Spain
  • Japan
  • China
  • Belgium
  • South Africa
  • Ireland
  • Switzerland

Records

  • 32,113,938
  • 1,864,484
  • 1,159,130
  • 735,018
  • 555,688
  • 387,241
  • 327,172
  • 228,287
  • 166,524
  • 156,251
  • 153,013
  • 134,027
  • 128,319
  • 118,470
  • 115,487
  • 108,688
  • 101,873
  • 100,336
  • 96,944
  • 95,154

Country

  • New Zealand
  • Denmark
  • Saudi Arabia
  • Mexico
  • Finland
  • Malaysia
  • Norway
  • Israel
  • Hong Kong
  • South Korea
  • Indonesia
  • Turkey
  • Philippines
  • Austria
  • Taiwan
  • Russia
  • Poland
  • Thailand
  • Argentina
  • Chile

Records

  • 84,550
  • 74,378
  • 67,439
  • 64,885
  • 62,512
  • 59,770
  • 57,220
  • 55,646
  • 53,094
  • 52,562
  • 48,861
  • 48,545
  • 45,927
  • 36,782
  • 36,231
  • 32,311
  • 31,863
  • 31,167
  • 26,946
  • 25,094

Country

  • Qatar
  • Kuwait
  • Czech Republic
  • Portugal
  • Egypt
  • Kenya
  • Pakistan
  • Romania
  • Greece
  • Nigeria
  • Luxembourg
  • Oman
  • Colombia
  • Hungary
  • Peru
  • Lebanon
  • Bahrain
  • Jordan
  • Sri Lanka
  • Others

Records

  • 23,681
  • 18,354
  • 17,931
  • 16,628
  • 16,593
  • 15,265
  • 14,156
  • 13,595
  • 13,405
  • 12,843
  • 12,663
  • 11,991
  • 11,125
  • 11,115
  • 10,981
  • 10,701
  • 9,909
  • 8,102
  • 6,671
  • 150,694

Map Customer Capacity
For Outsourcing Services

Gauge Current Employee Strength Of Your Top Customer

Uncover buying intent of companies who need Outsourcing servicesbased on the number of employees as a key parameter to map organizational growth.

Employee
Based Counts

Industry

  • 1-10
  • 11-25
  • 26-50
  • 51-100
  • 101-500
  • 501-1000
  • 1001-5000
  • 5001-10000
  • 10001+
  • Unclassified

Records

  • 170,993
  • 350,775
  • 1,017,026
  • 5,736,085
  • 2,177,005
  • 1,572,098
  • 2,256,508
  • 5,022,404
  • 15,764,981
  • 1,198,142
  • 4,982,213

Drill Down On
Your Top Customers

Segment Your Pitch By Industry AndDepartments

Emerge as a preferred partner for Outsourcing customers by hyper-personalizing your campaigns with Lake B2B Experts.

Industry
Based Counts

SIC Code

  • 01 – 09
  • 10 – 14
  • l5 – 17
  • 20 – 39
  • 40 – 49
  • 50 – 51
  • 52 – 59
  • 60 – 67
  • 70 – 89
  • 91 – 99

Industry

  • Agriculture, Forestry, Fishing
  • Mining
  • Construction
  • Manufacturing
  • Transportation & Public Utilities
  • Wholesale Trade
  • Retail Trade
  • Finance, Insurance, Real Estate
  • Services
  • Public Administration
  • Unclassified

Records

  • 170,993
  • 350,775
  • 1,017,026
  • 5,736,085
  • 2,177,005
  • 1,572,098
  • 2,256,508
  • 5,022,404
  • 15,764,981
  • 1,198,142
  • 4,982,213

Department Based Counts:

Department
Based Counts

Department

  • Sub Level Management
  • Finance
  • Top Level Management
  • IT
  • Operation
  • Education
  • Medical
  • Sales
  • Marketing
  • HR

Records

  • 6,205,473
  • 5,270,085
  • 3,897,565
  • 2,815,686
  • 2,705,620
  • 2,408,029
  • 1,782,123
  • 1,553,854
  • 1,403,113
  • 1,154,891

Department

  • Engineer
  • B&D
  • Legal
  • Customer Service
  • Arts & Entertainment
  • R&D
  • Purchasing
  • Architect
  • Sales & Marketing
  • Others

Records

  • 975,946
  • 889,487
  • 790,232
  • 624,707
  • 604,307
  • 589,883
  • 588,589
  • 347,354
  • 168,150
  • 5,473,136